numpy.random.RandomState.gumbel#
方法
- random.RandomState.gumbel(loc=0.0, scale=1.0, size=None)#
從耿貝爾分布中抽取樣本。
從具有指定位置和尺度的耿貝爾分布中抽取樣本。有關耿貝爾分布的更多資訊,請參閱下方的「註解與參考文獻」。
- 參數:
- locfloat 或 float 的類陣列物件,選用
分布眾數的位置。預設值為 0。
- scalefloat 或 float 的類陣列物件,選用
分布的尺度參數。預設值為 1。必須為非負數。
- sizeint 或 int 元組,選用
輸出形狀。如果給定的形狀為例如
(m, n, k),則會抽取m * n * k個樣本。如果 size 為None(預設值),則如果loc和scale都是純量,則會傳回單一值。否則,會抽取np.broadcast(loc, scale).size個樣本。
- 傳回:
- outndarray 或純量
從參數化的耿貝爾分布中抽取的樣本。
另請參閱
註解
耿貝爾分布(或最小極值 (SEV) 或第一型最小極值)分布是一類廣義極值 (GEV) 分布之一,用於極值問題建模。對於來自具有「類指數」尾部分布的最大值,耿貝爾分布是第一型極值分布的特例。
耿貝爾分布的機率密度為
\[p(x) = \frac{e^{-(x - \mu)/ \beta}}{\beta} e^{ -e^{-(x - \mu)/ \beta}},\]其中 \(\mu\) 是眾數(位置參數),而 \(\beta\) 是尺度參數。
耿貝爾分布(以德國數學家埃米爾·朱利葉斯·耿貝爾 (Emil Julius Gumbel) 命名)很早就用於水文學文獻中,用於模擬洪水事件的發生。它也用於模擬最大風速和降雨率。它是一種「肥尾」分布 - 尾部分布中事件的機率大於使用高斯分布時的機率,因此 100 年洪水事件的發生頻率出乎意料地高。洪水最初被建模為高斯過程,這低估了極端事件的頻率。
它是極值分布類別之一,即廣義極值 (GEV) 分布,其中也包括韋布爾分布和弗雷歇分布。
該函數的平均值為 \(\mu + 0.57721\beta\),變異數為 \(\frac{\pi^2}{6}\beta^2\)。
參考文獻
[1]Gumbel, E. J., “Statistics of Extremes,” New York: Columbia University Press, 1958.
[2]Reiss, R.-D. and Thomas, M., “Statistical Analysis of Extreme Values from Insurance, Finance, Hydrology and Other Fields,” Basel: Birkhauser Verlag, 2001.
範例
從分布中抽取樣本
>>> mu, beta = 0, 0.1 # location and scale
>>> s = np.random.gumbel(mu, beta, 1000)
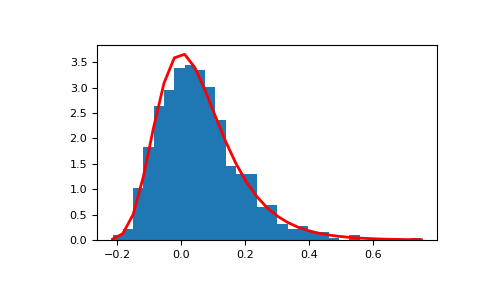
顯示樣本的直方圖,以及機率密度函數
>>> import matplotlib.pyplot as plt
>>> count, bins, ignored = plt.hist(s, 30, density=True)
>>> plt.plot(bins, (1/beta)*np.exp(-(bins - mu)/beta)
...          * np.exp( -np.exp( -(bins - mu) /beta) ),
...          linewidth=2, color='r')
>>> plt.show()
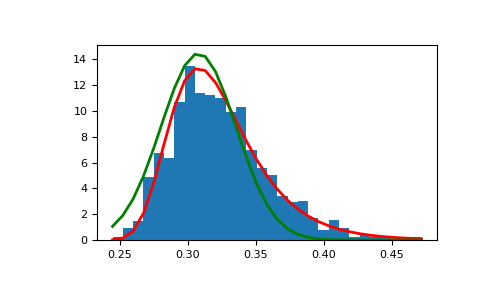
展示極值分布如何從高斯過程產生,並與高斯分布比較
>>> means = []
>>> maxima = []
>>> for i in range(0,1000) :
...    a = np.random.normal(mu, beta, 1000)
...    means.append(a.mean())
...    maxima.append(a.max())
>>> count, bins, ignored = plt.hist(maxima, 30, density=True)
>>> beta = np.std(maxima) * np.sqrt(6) / np.pi
>>> mu = np.mean(maxima) - 0.57721*beta
>>> plt.plot(bins, (1/beta)*np.exp(-(bins - mu)/beta)
...          * np.exp(-np.exp(-(bins - mu)/beta)),
...          linewidth=2, color='r')
>>> plt.plot(bins, 1/(beta * np.sqrt(2 * np.pi))
...          * np.exp(-(bins - mu)**2 / (2 * beta**2)),
...          linewidth=2, color='g')
>>> plt.show()