numpy.random.logistic#
- random.logistic(loc=0.0, scale=1.0, size=None)#
從邏輯分佈中抽取樣本。
樣本從具有指定參數的邏輯分佈中抽取,loc(位置或平均值,也是中位數)和 scale(>0)。
- 參數:
- locfloat 或 float 的類陣列 (array_like),選填
分佈的參數。預設值為 0。
- scalefloat 或 float 的類陣列 (array_like),選填
分佈的參數。必須是非負數。預設值為 1。
- sizeint 或 int 元組,選填
輸出形狀。如果給定的形狀是,例如
(m, n, k),則會抽取m * n * k個樣本。如果 size 為None(預設值),則當loc和scale都是純量時,會傳回單一值。否則,會抽取np.broadcast(loc, scale).size個樣本。
- 傳回值:
- outndarray 或 純量
從參數化的邏輯分佈中抽取的樣本。
另請參閱
scipy.stats.logistic機率密度函數、分佈或累積密度函數等等。
random.Generator.logistic新程式碼應使用此方法。
註解
邏輯分佈的機率密度為
\[P(x) = P(x) = \frac{e^{-(x-\mu)/s}}{s(1+e^{-(x-\mu)/s})^2},\]其中 \(\mu\) = 位置,\(s\) = 尺度。
邏輯分佈用於極值問題中,在這些問題中,它可以作為耿貝爾分佈的混合,也用於流行病學,以及世界西洋棋總會 (FIDE),在該總會中,它用於 Elo 排名系統,假設每位玩家的表現都是邏輯分佈的隨機變數。
參考文獻
[1]Reiss, R.-D. and Thomas M. (2001), “Statistical Analysis of Extreme Values, from Insurance, Finance, Hydrology and Other Fields,” Birkhauser Verlag, Basel, pp 132-133.
[2]Weisstein, Eric W. “Logistic Distribution.” From MathWorld–A Wolfram Web Resource. https://mathworld.wolfram.com/LogisticDistribution.html
[3]Wikipedia, “Logistic-distribution”, https://en.wikipedia.org/wiki/Logistic_distribution
範例
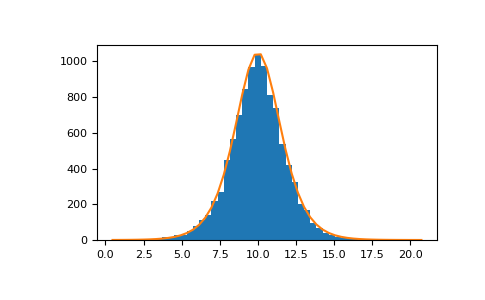
從分佈中抽取樣本
>>> loc, scale = 10, 1
>>> s = np.random.logistic(loc, scale, 10000)
>>> import matplotlib.pyplot as plt
>>> count, bins, ignored = plt.hist(s, bins=50)
# 繪製分佈圖
>>> def logist(x, loc, scale):
...     return np.exp((loc-x)/scale)/(scale*(1+np.exp((loc-x)/scale))**2)
>>> lgst_val = logist(bins, loc, scale)
>>> plt.plot(bins, lgst_val * count.max() / lgst_val.max())
>>> plt.show()