numpy.random.RandomState.logseries#
方法
- random.RandomState.logseries(p, size=None)#
從對數級數分佈中抽取樣本。
樣本是從具有指定形狀參數(0 <=
p< 1)的對數級數分佈中抽取的。- 參數:
- pfloat 或 float 的類陣列 (array_like)
分佈的形狀參數。必須在 [0, 1) 範圍內。
- sizeint 或 int 的 tuple,可選
輸出形狀。如果給定的形狀是例如
(m, n, k),則會抽取m * n * k個樣本。如果 size 為None(預設),如果p是純量,則會返回單個值。否則,會抽取np.array(p).size個樣本。
- 返回值:
- outndarray 或 純量
從參數化的對數級數分佈中抽取的樣本。
參見
scipy.stats.logser機率密度函數、分佈或累積密度函數等。
random.Generator.logseries新程式碼應使用的方法。
註解
對數級數分佈的機率密度為
\[P(k) = \frac{-p^k}{k \ln(1-p)},\]其中 p = 機率。
對數級數分佈經常被用於表示物種豐富度和發生率,最早由 Fisher、Corbet 和 Williams 在 1943 年提出 [2]。它也可用於模擬汽車中看到的乘員數量 [3]。
參考文獻
[1]Buzas, Martin A.; Culver, Stephen J., Understanding regional species diversity through the log series distribution of occurrences: BIODIVERSITY RESEARCH Diversity & Distributions, Volume 5, Number 5, September 1999 , pp. 187-195(9).
[2]Fisher, R.A,, A.S. Corbet, and C.B. Williams. 1943. The relation between the number of species and the number of individuals in a random sample of an animal population. Journal of Animal Ecology, 12:42-58.
[3]D. J. Hand, F. Daly, D. Lunn, E. Ostrowski, A Handbook of Small Data Sets, CRC Press, 1994.
[4]Wikipedia, “Logarithmic distribution”, https://en.wikipedia.org/wiki/Logarithmic_distribution
範例
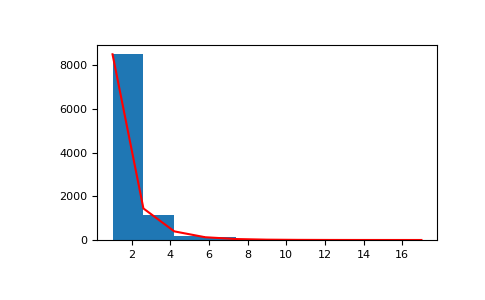
從分佈中抽取樣本
>>> a = .6
>>> s = np.random.logseries(a, 10000)
>>> import matplotlib.pyplot as plt
>>> count, bins, ignored = plt.hist(s)
# 繪製與分佈的關係圖
>>> def logseries(k, p):
...     return -p**k/(k*np.log(1-p))
>>> plt.plot(bins, logseries(bins, a)*count.max()/
...          logseries(bins, a).max(), 'r')
>>> plt.show()