numpy.random.Generator.pareto#
方法
- random.Generator.pareto(a, size=None)#
從具有指定形狀的 Pareto II (又名 Lomax) 分佈中抽取樣本。
- 參數:
- afloat 或 float 的類陣列 (array_like)
分佈的形狀。必須為正數。
- sizeint 或 int 元組,選用
輸出形狀。如果給定的形狀為,例如,
(m, n, k),則會抽取m * n * k個樣本。如果 size 為None(預設值),如果a是純量,則會傳回單一值。否則,會抽取np.array(a).size個樣本。
- 傳回值:
- outndarray 或 純量
從 Pareto II 分佈中抽取的樣本。
參見
scipy.stats.paretoPareto I 分佈
scipy.stats.lomaxLomax (Pareto II) 分佈
scipy.stats.genpareto廣義 Pareto 分佈
註解
Pareto II 分佈的機率密度函數為
\[p(x) = \frac{a}{{x+1}^{a+1}} , x \ge 0\]其中 \(a > 0\) 是形狀參數。
Pareto II 分佈是 Pareto I 分佈的位移和縮放版本,可以在
scipy.stats.pareto中找到。參考文獻
[1]Francis Hunt 和 Paul Johnson, On the Pareto Distribution of Sourceforge projects.
[2]Pareto, V. (1896). Course of Political Economy. Lausanne.
[3]Reiss, R.D., Thomas, M.(2001), Statistical Analysis of Extreme Values, Birkhauser Verlag, Basel, pp 23-30.
[4]Wikipedia, “Pareto distribution”, https://en.wikipedia.org/wiki/Pareto_distribution
範例
從分佈中抽取樣本
>>> a = 3.
>>> rng = np.random.default_rng()
>>> s = rng.pareto(a, 10000)
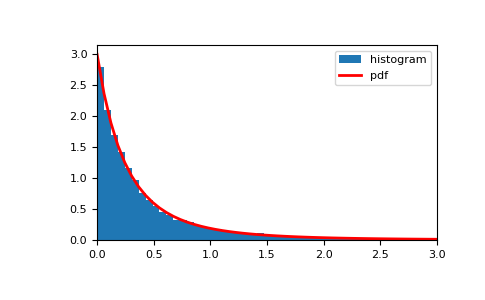
顯示樣本的直方圖,以及機率密度函數
>>> import matplotlib.pyplot as plt
>>> x = np.linspace(0, 3, 50)
>>> pdf = a / (x+1)**(a+1)
>>> plt.hist(s, bins=x, density=True, label='histogram')
>>> plt.plot(x, pdf, linewidth=2, color='r', label='pdf')
>>> plt.xlim(x.min(), x.max())
>>> plt.legend()
>>> plt.show()