numpy.random.Generator.noncentral_chisquare#
方法
- random.Generator.noncentral_chisquare(df, nonc, size=None)#
從非中心卡方分佈中抽取樣本。
非中心 \(\chi^2\) 分佈是 \(\chi^2\) 分佈的推廣。
- 參數:
- dffloat 或 float 的類陣列 (array_like)
自由度,必須 > 0。
- noncfloat 或 float 的類陣列 (array_like)
非中心性,必須是非負數。
- sizeint 或 int 元組,可選
輸出形狀。如果給定的形狀是例如
(m, n, k),則會抽取m * n * k個樣本。如果 size 是None(預設值),如果df和nonc都是純量,則會回傳單一值。否則,會抽取np.broadcast(df, nonc).size個樣本。
- 回傳:
- outndarray 或 純量
從參數化的非中心卡方分佈中抽取的樣本。
說明
非中心卡方分佈的機率密度函數為
\[P(x;df,nonc) = \sum^{\infty}_{i=0} \frac{e^{-nonc/2}(nonc/2)^{i}}{i!} P_{Y_{df+2i}}(x),\]其中 \(Y_{q}\) 是自由度為 q 的卡方分佈。
參考文獻
[1]Wikipedia, “Noncentral chi-squared distribution” https://en.wikipedia.org/wiki/Noncentral_chi-squared_distribution
範例
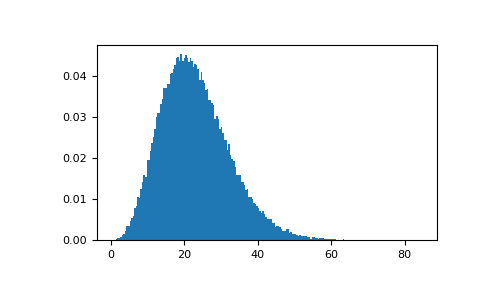
從分佈中抽取值並繪製直方圖
>>> rng = np.random.default_rng()
>>> import matplotlib.pyplot as plt
>>> values = plt.hist(rng.noncentral_chisquare(3, 20, 100000),
...                   bins=200, density=True)
>>> plt.show()
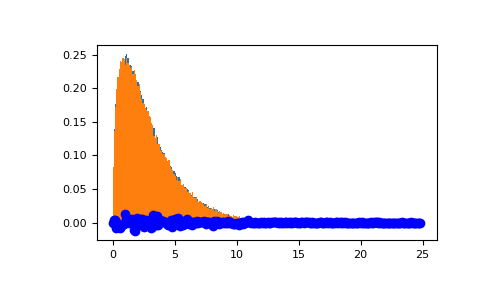
從非中心性非常小的非中心卡方分佈中抽取值,並與卡方分佈進行比較。
>>> plt.figure()
>>> values = plt.hist(rng.noncentral_chisquare(3, .0000001, 100000),
...                   bins=np.arange(0., 25, .1), density=True)
>>> values2 = plt.hist(rng.chisquare(3, 100000),
...                    bins=np.arange(0., 25, .1), density=True)
>>> plt.plot(values[1][0:-1], values[0]-values2[0], 'ob')
>>> plt.show()
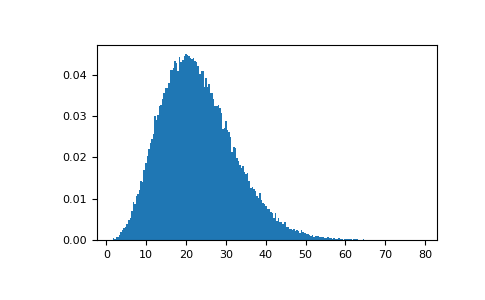
示範非中心性的大值如何導致更對稱的分佈。
>>> plt.figure()
>>> values = plt.hist(rng.noncentral_chisquare(3, 20, 100000),
...                   bins=200, density=True)
>>> plt.show()