numpy.geomspace#
- numpy.geomspace(start, stop, num=50, endpoint=True, dtype=None, axis=0)[原始碼]#
回傳在對數尺度上均勻間隔的數字(等比數列)。
這與
logspace相似,但直接指定端點。每個輸出樣本都是前一個樣本的常數倍數。- 參數:
- startarray_like
序列的起始值。
- stoparray_like
序列的最終值,除非 endpoint 為 False。在這種情況下,
num + 1個值在對數空間的區間上均勻間隔,其中除了最後一個(長度為 num 的序列)之外的所有值都會回傳。- numinteger, optional
要產生的樣本數。預設值為 50。
- endpointboolean, optional
如果為 true,則 stop 是最後一個樣本。否則,不包含在內。預設值為 True。
- dtypedtype
輸出陣列的型態。如果未給定
dtype,則資料型態會從 start 和 stop 推斷。推斷的 dtype 永遠不會是整數;即使參數會產生整數陣列,也會選擇 float。- axisint, optional
結果中儲存樣本的軸。僅當 start 或 stop 為 array-like 時才相關。依預設 (0),樣本將沿著開頭插入的新軸排列。使用 -1 可在結尾取得軸。
- 回傳值:
- samplesndarray
num 個樣本,在對數尺度上均勻間隔。
另請參閱
logspace與 geomspace 相似,但使用對數和底數指定端點。
linspace與 geomspace 相似,但使用算術級數而不是等比級數。
arange與 linspace 相似,但指定步長而不是樣本數。
- 如何建立具有規則間隔值的陣列
筆記
如果輸入或 dtype 是複數,則輸出將在複數平面中遵循對數螺線。(有無數條螺線穿過兩點;輸出將遵循最短的路徑。)
範例
>>> import numpy as np
>>> np.geomspace(1, 1000, num=4)
array([    1.,    10.,   100.,  1000.])
>>> np.geomspace(1, 1000, num=3, endpoint=False)
array([   1.,   10.,  100.])
>>> np.geomspace(1, 1000, num=4, endpoint=False)
array([   1.        ,    5.62341325,   31.6227766 ,  177.827941  ])
>>> np.geomspace(1, 256, num=9)
array([   1.,    2.,    4.,    8.,   16.,   32.,   64.,  128.,  256.])
請注意,以上可能不會產生精確的整數
>>> np.geomspace(1, 256, num=9, dtype=int)
array([  1,   2,   4,   7,  16,  32,  63, 127, 256])
>>> np.around(np.geomspace(1, 256, num=9)).astype(int)
array([  1,   2,   4,   8,  16,  32,  64, 128, 256])
允許負數、遞減和複數輸入
>>> np.geomspace(1000, 1, num=4)
array([1000.,  100.,   10.,    1.])
>>> np.geomspace(-1000, -1, num=4)
array([-1000.,  -100.,   -10.,    -1.])
>>> np.geomspace(1j, 1000j, num=4)  # Straight line
array([0.   +1.j, 0.  +10.j, 0. +100.j, 0.+1000.j])
>>> np.geomspace(-1+0j, 1+0j, num=5)  # Circle
array([-1.00000000e+00+1.22464680e-16j, -7.07106781e-01+7.07106781e-01j,
        6.12323400e-17+1.00000000e+00j,  7.07106781e-01+7.07106781e-01j,
        1.00000000e+00+0.00000000e+00j])
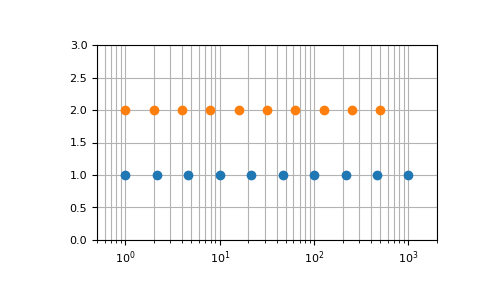
endpoint 參數的圖形化說明
>>> import matplotlib.pyplot as plt
>>> N = 10
>>> y = np.zeros(N)
>>> plt.semilogx(np.geomspace(1, 1000, N, endpoint=True), y + 1, 'o')
[<matplotlib.lines.Line2D object at 0x...>]
>>> plt.semilogx(np.geomspace(1, 1000, N, endpoint=False), y + 2, 'o')
[<matplotlib.lines.Line2D object at 0x...>]
>>> plt.axis([0.5, 2000, 0, 3])
[0.5, 2000, 0, 3]
>>> plt.grid(True, color='0.7', linestyle='-', which='both', axis='both')
>>> plt.show()