numpy.random.standard_gamma#
- random.standard_gamma(shape, size=None)#
從標準 Gamma 分佈中抽取樣本。
樣本是從具有指定參數(形狀,有時稱為 “k”)和尺度=1 的 Gamma 分佈中抽取的。
注意
新程式碼應改用
Generator實例的standard_gamma方法;請參閱快速入門。- 參數:
- shapefloat 或 float 的類陣列 (array_like)
參數,必須是非負數。
- sizeint 或 int 元組,選用
輸出形狀。如果給定的形狀是例如
(m, n, k),則會抽取m * n * k個樣本。如果 size 是None(預設值),則如果shape是純量,則會傳回單一值。否則,會抽取np.array(shape).size個樣本。
- 返回:
- outndarray 或 純量
從參數化的標準 gamma 分佈中抽取的樣本。
另請參閱
scipy.stats.gamma機率密度函數、分佈或累積密度函數等等。
random.Generator.standard_gamma新程式碼應使用的方法。
註解
Gamma 分佈的機率密度為
\[p(x) = x^{k-1}\frac{e^{-x/\theta}}{\theta^k\Gamma(k)},\]其中 \(k\) 是形狀,\(\theta\) 是尺度,而 \(\Gamma\) 是 Gamma 函數。
Gamma 分佈常用於模擬電子元件的故障時間,並且自然地出現在 Poisson 分佈事件之間的等待時間相關的過程中。
參考文獻
[1]Weisstein, Eric W. “Gamma Distribution.” From MathWorld–A Wolfram Web Resource. https://mathworld.wolfram.com/GammaDistribution.html
[2]Wikipedia, “Gamma distribution”, https://en.wikipedia.org/wiki/Gamma_distribution
範例
從分佈中抽取樣本
>>> shape, scale = 2., 1. # mean and width
>>> s = np.random.standard_gamma(shape, 1000000)
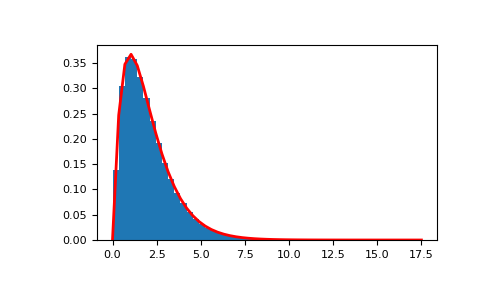
顯示樣本的直方圖,以及機率密度函數
>>> import matplotlib.pyplot as plt
>>> import scipy.special as sps
>>> count, bins, ignored = plt.hist(s, 50, density=True)
>>> y = bins**(shape-1) * ((np.exp(-bins/scale))/
...                       (sps.gamma(shape) * scale**shape))
>>> plt.plot(bins, y, linewidth=2, color='r')
>>> plt.show()